
Introducing Continuous Cost Governance
Extending FinOps from Cost Optimization to Financial Accountability. A vendor-neutral control and measurement & verification (M&V) specification for consumption-based cloud and AI expenditure.
Author: Andy Surujnarine (ORCID: 0009-0004-0144-1497)
Affiliation: Founder, Compute LLC; Cloud Operations & Security Practitioner
Continuous Cost Governance in One Sentence
FinOps determines what should be done with technology spend. Continuous Cost Governance establishes what was actually done, on whose authority, and what it verifiably delivered.
01 · Executive Summary
The Unattended Seam Between Engineering Telemetry and Finance Control
Between 2019 and 2026, cloud financial management matured from an improvised practice into a recognised discipline. The FinOps Foundation's framework gave the field a shared vocabulary, a persona model, and a capability map; the FOCUS specification began to normalise billing data across providers; and the major cloud vendors embedded cost optimisation into their reference architectures. The discipline has succeeded on its own terms.
It has also moved. The State of FinOps 2026 survey of 1,192 practitioners managing more than $83 billion in annual cloud spend reports that 78% of FinOps practices now sit within the CTO or CIO organisation, while the share reporting to the CFO has fallen to 8% (FinOps Foundation, 2026a). FinOps has shifted up into technology strategy and left into engineering workflow. It has not, on the evidence, shifted across into the finance control environment.
A technical recommendation becomes a financial result only when someone is accountable for it, someone authorises it, someone implements it, and someone independently measures what actually changed. Those steps are the ordinary substance of internal control in every other category of corporate expenditure. In consumption-based technology spend they are, in most organisations, not systematically performed, and the industry's headline metric, “potential savings,” measures the absence of that discipline.
This working paper proposes Continuous Cost Governance (CCG): a control specification that treats each material optimisation decision as a governed transaction carrying decision-grade evidence, a named accountable owner, a risk-proportionate authorisation, and an independently verified outcome against an adjusted baseline.
Three Contributions, and No More
CONTRIBUTION 01
A Decision-Centric Governance Model
Proposes the individual cost decision, rather than the period, the resource, or the service, as the unit of governance, with a defined seven-stage lifecycle and a retained evidentiary record.
CONTRIBUTION 02
A Reportability Standard for Realised Savings
Separates what may be tracked operationally from what may be reported as a financial result, grounded in IPMVP and ASHRAE Guideline 14 measurement and verification practice and transposed to consumption-based spend in Appendix A.
CONTRIBUTION 03
A Control Specification Extending FinOps
Locates the specification inside the FinOps Framework's Policy & Governance capability and connects first-line engineering practice to second-line financial controllership and third-line audit assurance (IIA Three Lines Model).
02 · Normative Commitments
The Five Principles of CCG
Separating durable normative commitments from sequential process steps yields five principles that govern the framework.
Cost decisions are governed as transactions, not as reports.
The unit of governance is the individual decision, not the monthly bill or the quarterly review. A finding without a lifecycle is a suggestion.
A finding must carry evidence sufficient to bear the decision it requests.
The evidentiary burden sits with the party proposing the change, not the party absorbing its risk. Sufficiency scales with consequence: a sustained-utilisation percentile analysis with headroom against observed peak may suffice for a stateless workload; a tier-one transactional system warrants more.
Every finding has a named accountable owner with authority to act.
Ownership is a person or a defined role, derived where possible from identity systems rather than inferred from resource metadata alone. A cost centre is not an owner.
Control is proportionate to materiality and risk.
Governance applied uniformly to all decisions is governance that will be circumvented. Most findings should flow through lightweight, automatable paths; formal review and separated authorisation should be reserved for decisions that are financially material, operationally risky, or both.
Only verified outcomes are reported as financial results.
Estimated, potential, and avoided savings may be tracked, and are useful operationally. They are not reported to finance, to executives, or to the board as achieved results. Verification means comparison against a baseline adjusted for business volume, rate changes, and seasonality.
03 · Process Specification
The Continuous Governance Loop
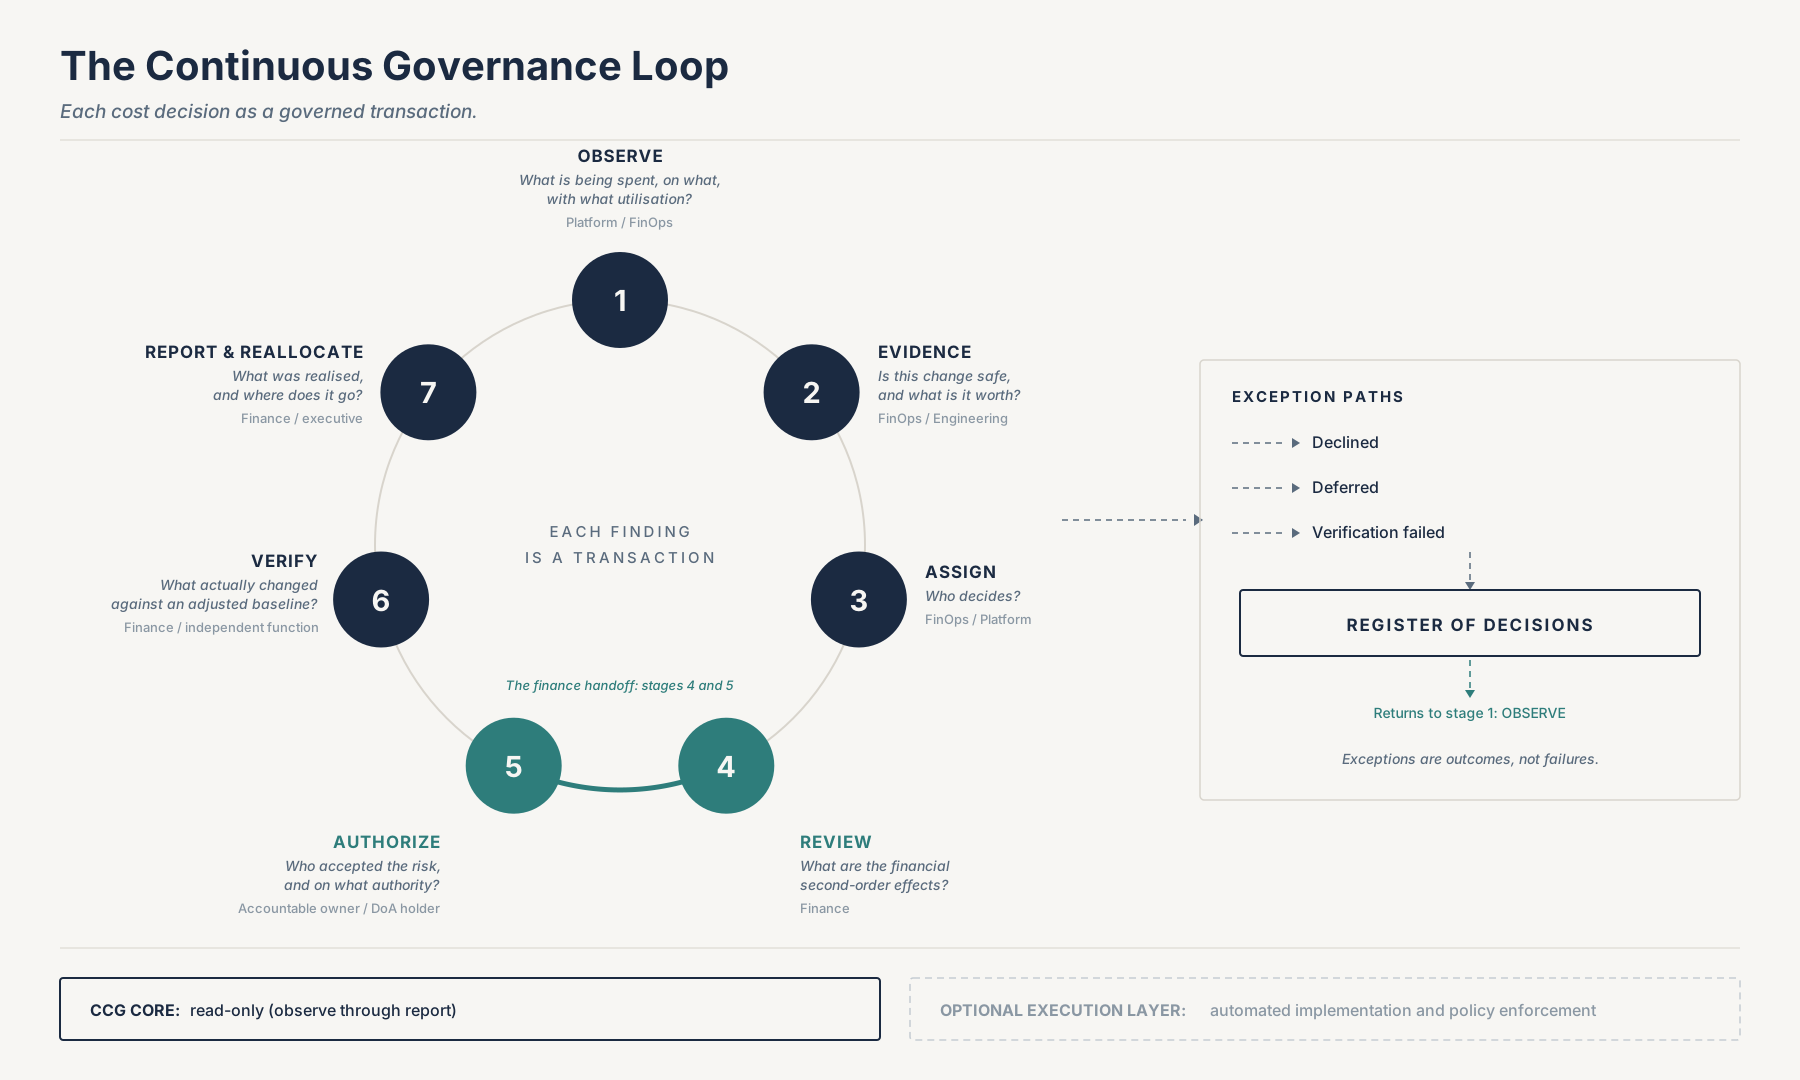
Each material cost finding passes through a seven-stage loop with explicit exception paths. A control with no documented rejection path is not an auditable control: Declined, Deferred, and Verification failed are recorded as first-class outcomes in the Register of Decisions.
| Stage | Question Answered | Primary Owner |
|---|---|---|
| 1. Observe | What is being spent, on what, with what utilisation? | Platform / FinOps |
| 2. Evidence | Is this change safe, and what is it worth? | FinOps / Engineering |
| 3. Assign | Who decides? | FinOps / Platform |
| 4. Review | What are the financial second-order effects? | Finance |
| 5. Authorize | Who accepted the risk, and on what authority? | Accountable owner / DoA holder |
| 6. Verify | What actually changed against an adjusted baseline? | Finance / independent function |
| 7. Report & Reallocate | What was realised, and where does it go? | Finance / executive |
04 · Layered Dependency
The Governance Pyramid
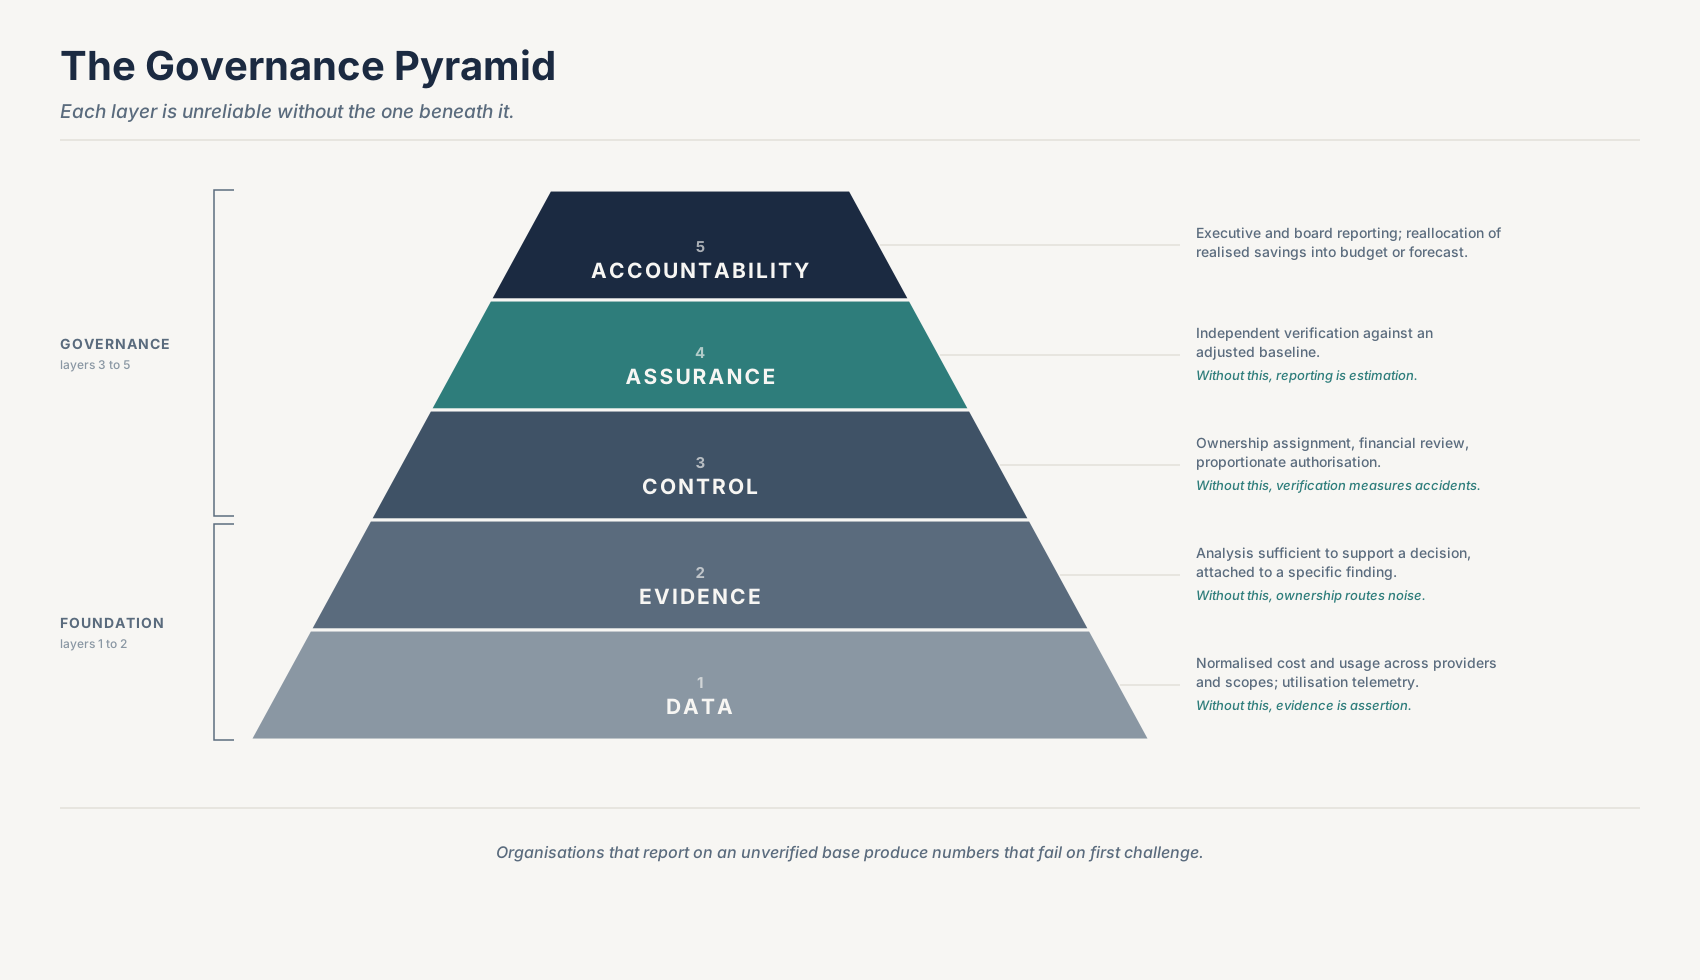
CCG comprises five dependent layers, in which each layer is unreliable without the integrity of the layer beneath it. Organisations that attempt executive reporting on an unverified base produce numbers that fail on first challenge.
05 · Capability Progression
The CCG Maturity Model
Offered not as a replacement for the FinOps Crawl/Walk/Run model, but as a finer-grained view of two axes (control and verification) where the transition from Level 3 (Optimising) to Level 4 (Governed) requires connecting engineering workflow to financial controllership.
| Level | Visibility | Ownership | Control | Verification | Reporting |
|---|---|---|---|---|---|
| 1. Reactive | Fragmented billing data | Unassigned | None | None | Ad hoc |
| 2. Visible | Centralised billing | Tag/metadata based | Manual alerts | Estimated avoidance | Periodic dashboards |
| 3. Optimising | Cost plus utilisation | Team-level mapping | Advisory workflow | Simple before/after | Variance narrative |
| 4. Governed | Normalised multi-scope | Identity-derived, named | Risk-proportionate authorisation with recorded decisions | Baseline-adjusted M&V | Reviewable evidence |
| 5. Continuous | Real-time unit economics | Federated with automated routing | Integrated with GRC and change systems | Continuous M&V with estimate calibration | Reconciled to budget and forecast |
06 · Illustrative Walkthrough
Worked Example: From $24,100 Naive Estimate to $15,950 Verified Saving
Consider a single rightsizing finding on a fourteen-instance production application tier (synthetic figures illustrating the arithmetic of verification). Four of the seven stages materially alter the figure before it reaches a financial report:
Stage 1 (Observe) & Stage 2 (Evidence): Cost tooling flags 14 instances at 11% mean CPU and estimates $24,100 annualised. Ninety-day P99 analysis reveals a four-hour month-end financial-close spike on 3 instances. Those 3 are recorded as Declined with documented rationale; 11 instances remain in scope ($18,900 revised estimate).
Stage 4 (Finance Review): Finance identifies that withdrawing on-demand usage from this instance family would drop a three-year compute commitment below break-even, transferring cost to an unused reservation rather than removing it from the P&L. Finance directs that freed capacity be backfilled with an uncommitted workload.
Stage 6 (Verify) & Stage 7 (Report): Ninety days post-change, gross observed reduction is $19,400. Baseline adjustment removes $450 for a 6% transaction-volume decline (using measured baseline cost elasticity e = 0.19), $1,850 for a provider list-rate cut, and $1,150 for the non-routine commitment transfer. Only $15,950 is reported as a financial result.
Verification Waterfall (Annualised)
- Naive estimate at finding (14 instances)
- $24,100
- Estimate after evidence (11 instances)
- $18,900
- Gross observed reduction (B - R)
- $19,400
- Less: demand normalisation (-6% vol, e=0.19)
- ($450)
- Less: provider list-rate reduction
- ($1,850)
- Less: commitment reallocation (non-routine)
- ($1,150)
- Verified realised saving
- $15,950
07 · Institutional Alignment
How CCG Extends FinOps and TBM
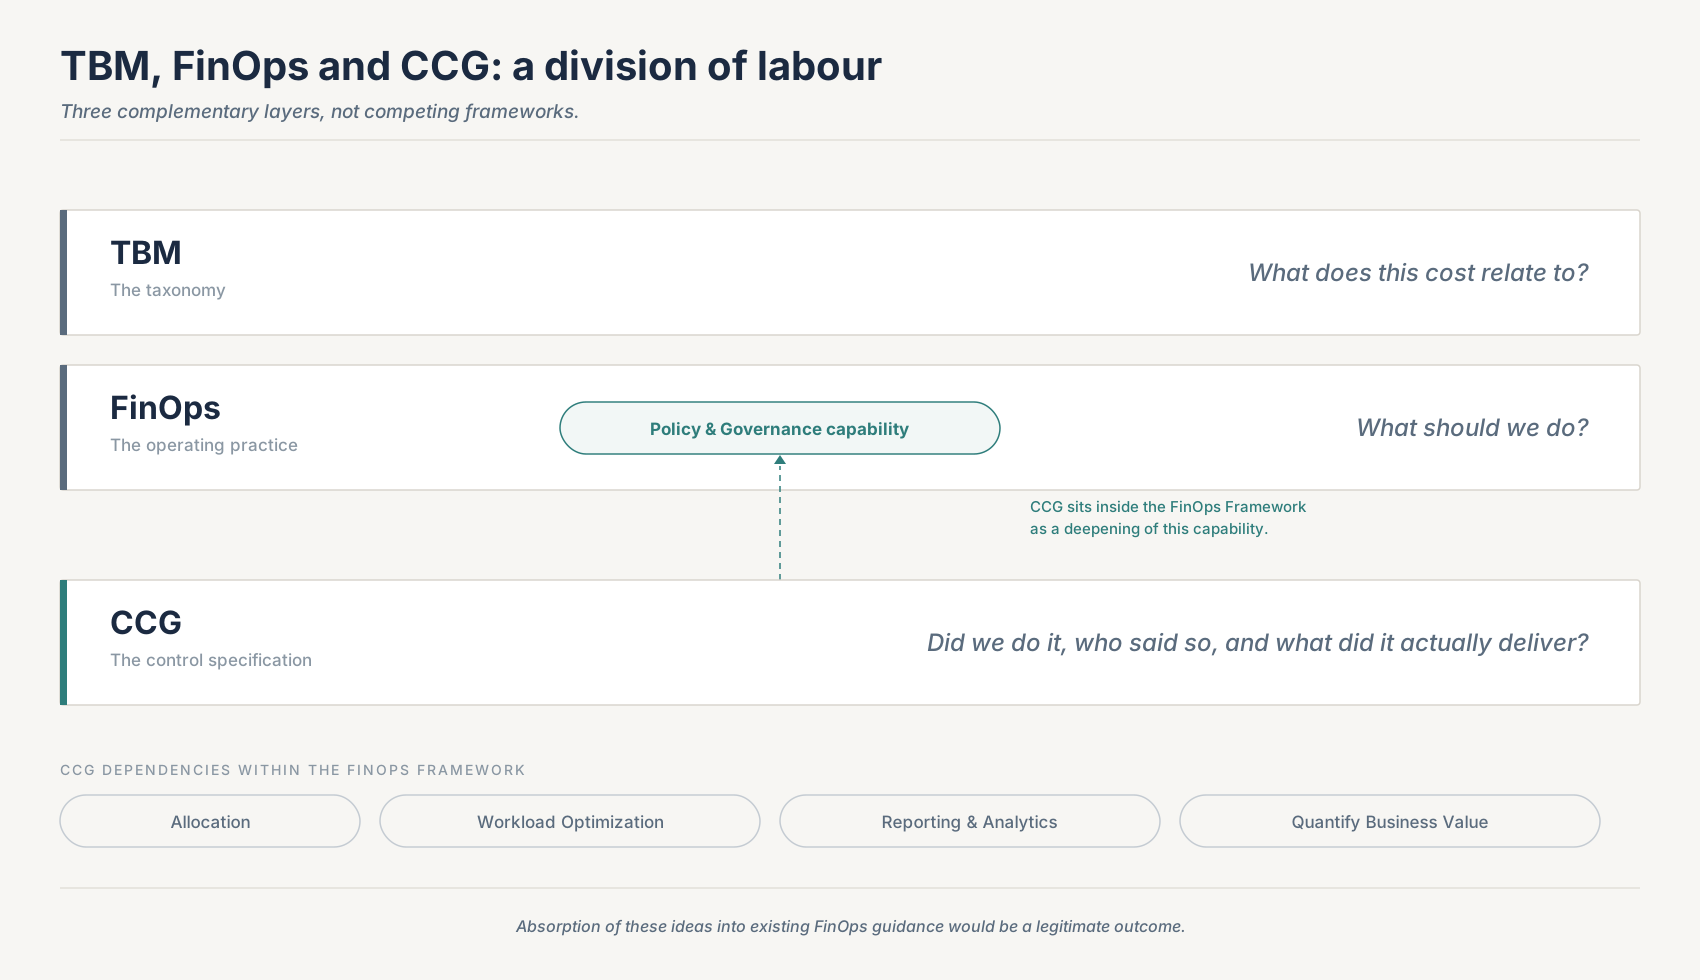
TBM provides the taxonomy (what does this cost relate to?). FinOps provides the operating practice (what should we do?). CCG proposes the control specification (did we do it, who said so, and what did it actually deliver?), sitting naturally inside the FinOps Framework's Policy & Governance capability.
08 · Appendix A
A Measurement and Verification Protocol for Consumption-Based Spend
Principle 5 states that only verified outcomes are reported as financial results, yet no cloud equivalent of the energy sector's International Performance Measurement and Verification Protocol (IPMVP) exists. Appendix A transposes IPMVP and ASHRAE Guideline 14-2023 to FOCUS-normalised (EffectiveCost) cloud and AI expenditure so that Principle 5 is executable rather than aspirational.
The Adjusted-Baseline Savings Equation
S = B · (D_r / D_b)^e · ρ − R − ΣA_nr
B, R: Annualised amortised cost (FOCUS EffectiveCost, never BilledCost) of the governed scope in the baseline and reporting periods.
D_b, D_r: Demand driver volume in the baseline and reporting windows.
e: Cost elasticity of the governed scope to demand, estimated from the baseline window (representing the variable-cost share at baseline), never assumed at 1.0.
ρ & A_nr: Unit rate factor (evaluated on FOCUS ListCost or ContractedCost) and pre-registered non-routine adjustments.
| IPMVP-Transposed Option | What Is Measured | Cloud Application | Reportable under Principle 5? |
|---|---|---|---|
| Option A: Isolation, key parameter | The changed parameter only: resource count or size times amortised unit rate | High-volume, low-materiality configuration changes resolving on automated paths | Yes, within Tier 1 materiality limits |
| Option B: Isolation, all parameters | Full amortised cost (FOCUS EffectiveCost) of the governed scope in both periods | A single identifiable finding, which is the default for anything reaching stages 4 and 5 | Yes |
| Option C: Whole-scope regression | Total amortised cost of an account, subscription, or product scope regressed on drivers | Diffuse or policy-driven change across many resources where isolation is impossible | Only if the ASHRAE 14 two-sigma detectability test (S >= 2 * SE) is met |
| Option D: Calibrated counterfactual | Nothing; the baseline is modelled | Net-new workloads, prevented spend, and architectural avoidance where no measured baseline exists | No. Operational tracking only |
Why Assuming Unit Elasticity (e = 1.0) Fails
Statically provisioned capacity has an elasticity near zero because its cost is set by provisioning, not demand. In the worked example, assuming e = 1.0 instead of measuring e = 0.19 would have deducted $2,286 instead of $445 for demand normalisation, understating the verified saving by 12% from a single unexamined assumption.
Option C & The ASHRAE 14 Two-Sigma Detectability Test
For diffuse, whole-scope changes (Option C), a saving is reportable only if Fractional Savings Uncertainty does not exceed 50% at the 68% confidence level (ASHRAE Guideline 14-2023), which is algebraically identical to requiring S >= 2 * SE(S) after adjusting for lag-1 autocorrelation in daily cost.
09 · Citation & Archival Record
How to Cite This Paper
APA Format
Surujnarine, A. (2026). Introducing Continuous Cost Governance: Extending FinOps from Cost Optimization to Financial Accountability (Working Paper Version 1.4). Compute LLC. https://surujnarine.net/ccg
BibTeX
@techreport{surujnarine2026ccg,
  author      = {Surujnarine, Andy},
  title       = {Introducing Continuous Cost Governance: Extending FinOps from Cost Optimization to Financial Accountability},
  institution = {Compute LLC},
  year        = {2026},
  month       = oct,
  type        = {Working Paper},
  number      = {Version 1.4},
  url         = {https://surujnarine.net/ccg}
}
Read the complete 28-page specification, prior-art crosswalk, and worked Appendix A calculations in the full working paper.